जो risk बार-बार होता है, AI उसे पहले से “इशारा” कर देता है
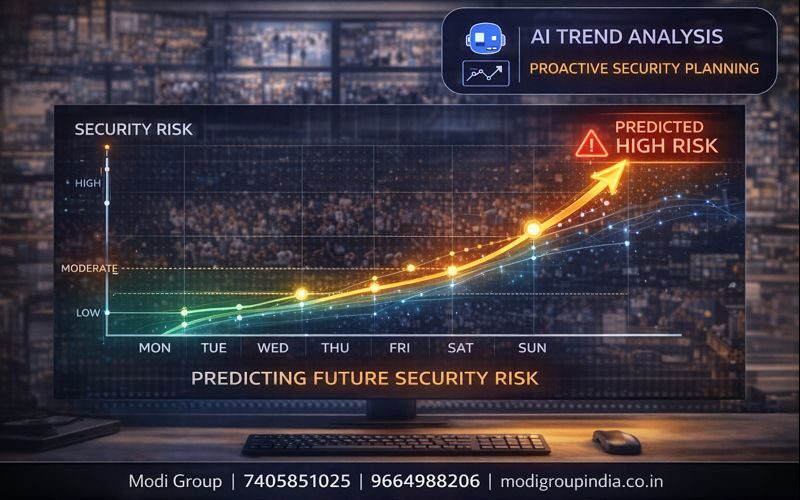
कई जगह पर risk “random” नहीं होता, उसका एक pattern होता है— किस दिन, किस time, किस zone में ज्यादा chances होते हैं। Predictive Risk Analytics में AI पुराने CCTV alerts, incidents और activity trend को देखकर high-risk time/zone का अनुमान (prediction) देता है, ताकि security पहले से तैयार रहे।
“Past data → pattern → risk forecast → security plan ready”
विषय सूची
Predictive analytics “आज” का alert नहीं, “आने वाले समय” की planning के लिए सबसे ज्यादा काम आता है।
Matlab: Predictive Risk Analytics क्या होता है?
Predictive Risk Analytics का मतलब है— पुराने CCTV data (incidents, alerts, footfall, timing) से risk का pattern निकालना और बताना कि किस time और किस zone में risk ज्यादा हो सकता है।
AI कौन सा data देखता है? (Inputs)
- Alerts history: intrusion/loitering/violence जैसे alerts का record
- Incident logs: theft, conflict, entry violations के notes
- Time pattern: day/time/holiday/weekend behavior
- Zone pattern: कौन सा gate/aisle/corner ज्यादा sensitive है
- Footfall trend: crowd/people count (अगर enable हो)
यह कैसे काम करता है (Simple Steps)
- 1) Data collect: cameras + analytics events से logs बनते हैं
- 2) Pattern निकले: time/zone के हिसाब से trends निकलते हैं
- 3) Correlation: crowd + incidents + alerts का relation देखा जाता है
- 4) Risk score: zone/time को 0–100 जैसे score मिलते हैं
- 5) Forecast: अगले week/month के high-risk slots दिखते हैं
- 6) Action plan: guard shift/patrol/automation पहले से set
Output में क्या मिलेगा?
- High-risk time slots (जैसे Fri 7–9 PM)
- High-risk zones (जैसे Zone-B corner)
- Risk Heatmap (रंगों में area risk)
- Recommended actions (patrol बढ़ाओ / alerts strict करो)
- Weekly/Monthly report
Reports क्या मिलती हैं?
- Risk Heatmap Report: कौन सा area ज्यादा risk वाला
- Time Trend Report: किस दिन/समय risk peak होता है
- Top 5 Risk Zones: priority zones list
- Top 5 Risk Time Slots: priority time list
- Incident Category Report: theft/loitering/violence किस type में ज्यादा
Example: Retail Store
Retail store में पुराने data से पता चला: Friday शाम को crowd ज्यादा होता है और billing counter के पास internal theft/fraud chance बढ़ता है।
- AI ने Friday 7–9 PM को high-risk slot दिखाया
- Zone: billing + exit gate को high-risk zone दिखाया
- Action: extra guard + POS+Video check + alerts strict
- Result: loss कम, response तेज, management control मजबूत
मुख्य फायदे (Benefits)
- Proactive security: risk से पहले तैयारी
- Better resource planning: guard/shift/patrol सही जगह
- Loss prevention: चोरी/नुकसान में कमी
- Management clarity: guess नहीं—data-driven decision
- Audit support: reports से policy improvements आसान
सही Setup Tips (Accuracy बढ़ाने के लिए)
- Zones define: entry/exit/billing/warehouse corner अलग-अलग zones
- Consistent logging: incidents को short notes में record करें
- Time rules: weekday vs weekend अलग trend होता है
- Data window: कम से कम 2–4 हफ्ते का data रखें (बेहतर pattern)
- Review cycle: weekly review करके thresholds fine-tune करें
Limitations (सीमा) — यह जानना जरूरी है
- New location: शुरुआत में past data कम होगा तो prediction limited होगी
- Sudden events: festival, emergency, strike जैसे unexpected changes को predict करना मुश्किल
- Data quality: गलत/अधूरा logging हो तो output weak होगा
- Guarantee नहीं: यह planning tool है, final decision management का
FAQ (सामान्य प्रश्न)
क्या यह feature live alert भी देता है?
Predictive analytics का main काम planning है। Live alerts अलग analytics (intrusion, loitering आदि) से आते हैं। दोनों साथ में best result देते हैं।
कितने दिनों का data चाहिए?
Practical prediction के लिए कम से कम 2–4 हफ्ते का consistent data अच्छा रहता है। ज्यादा data होगा तो trend और साफ होगा।
क्या small shop में भी फायदा है?
हाँ, अगर theft/fraud pattern repeat होता है तो छोटे setup में भी useful है—बस zones और basic logging सही रखें।
Reports कौन देखेगा?
Owner/manager/security supervisor—जो shift planning और security SOP बनाता है, उसके लिए यह report सबसे useful है।